Visual control
Do you need a BRANDMELDPANEEL?
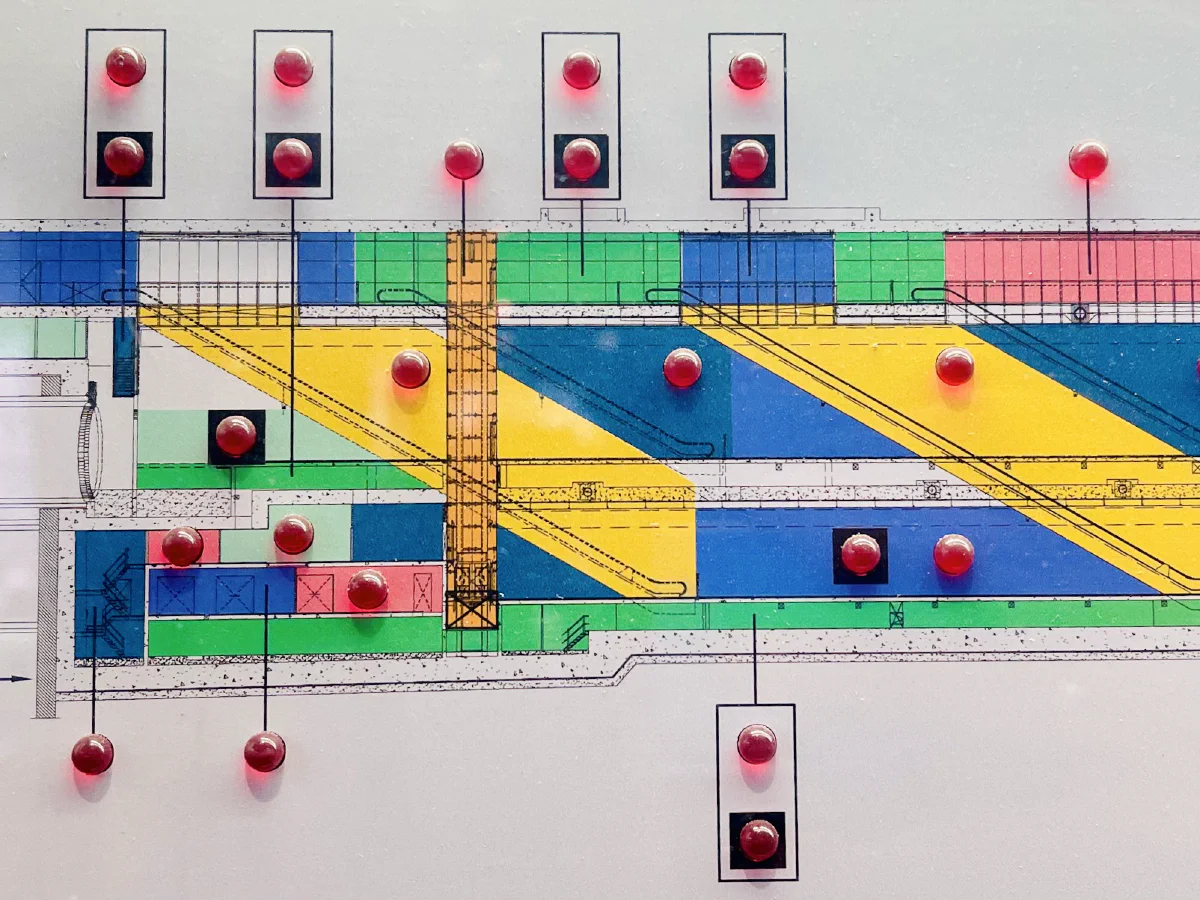
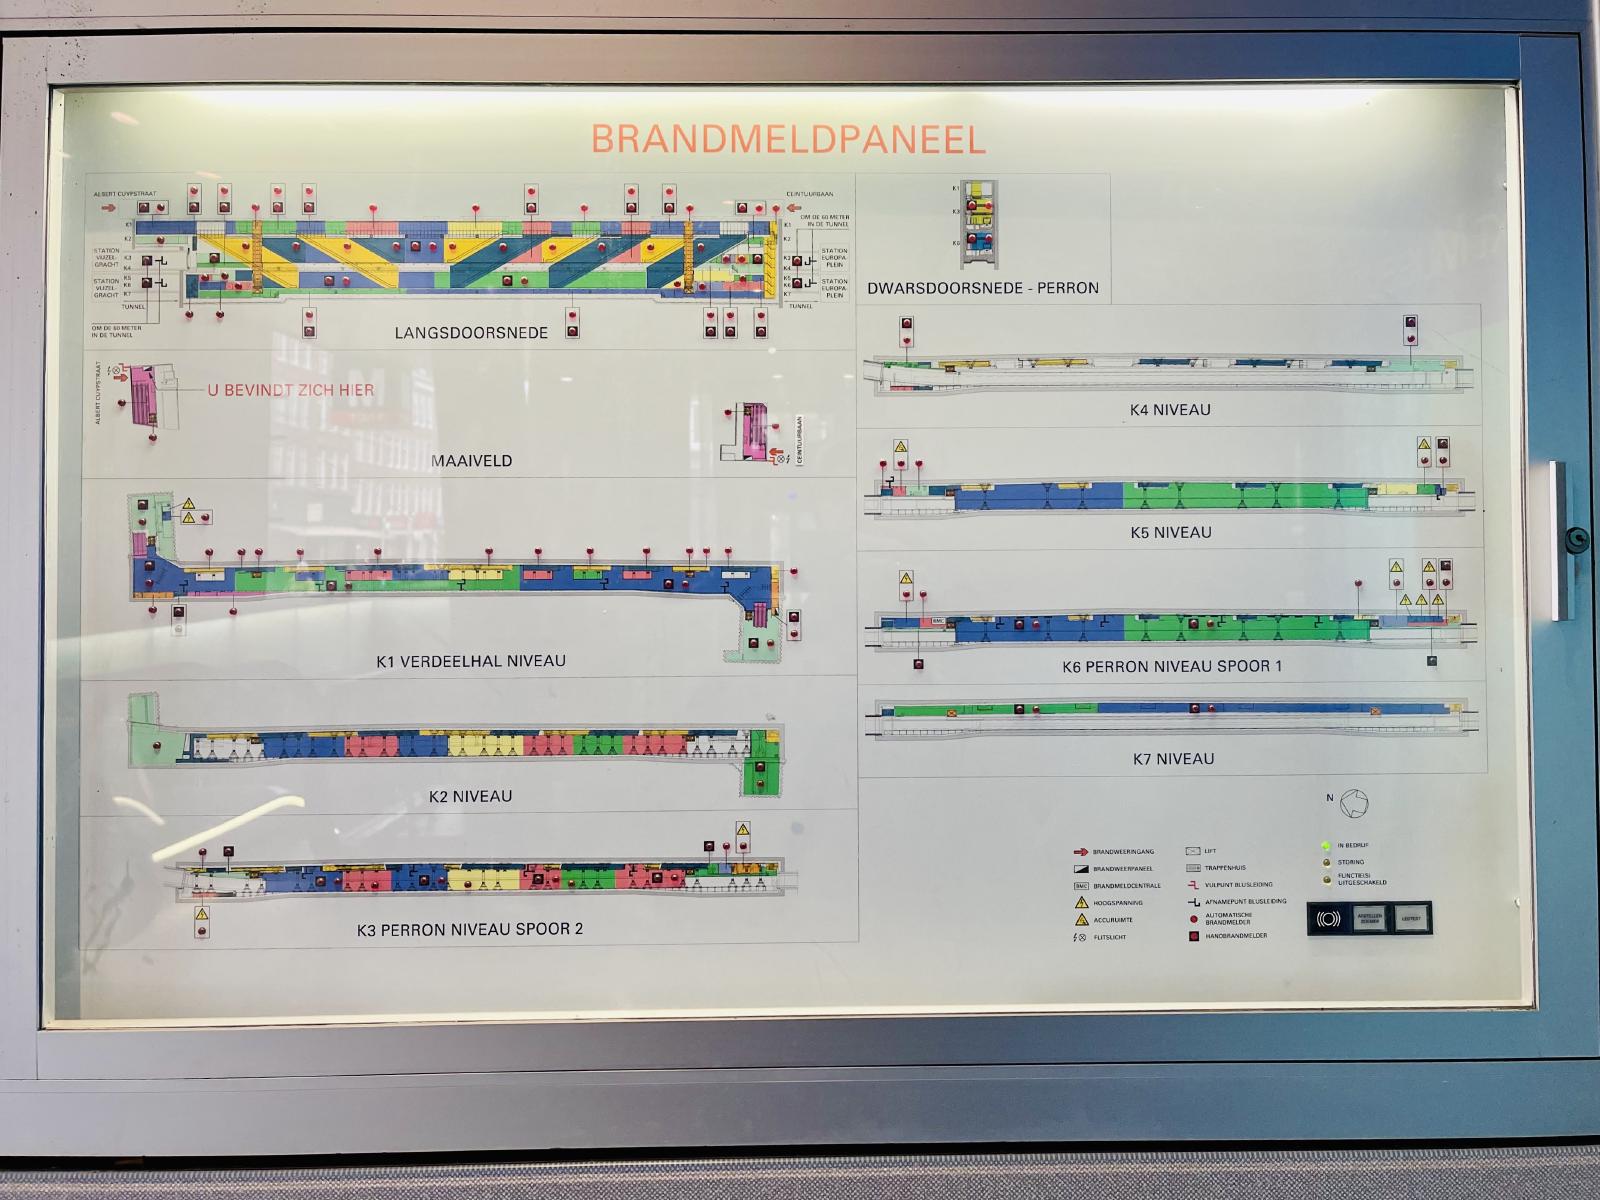
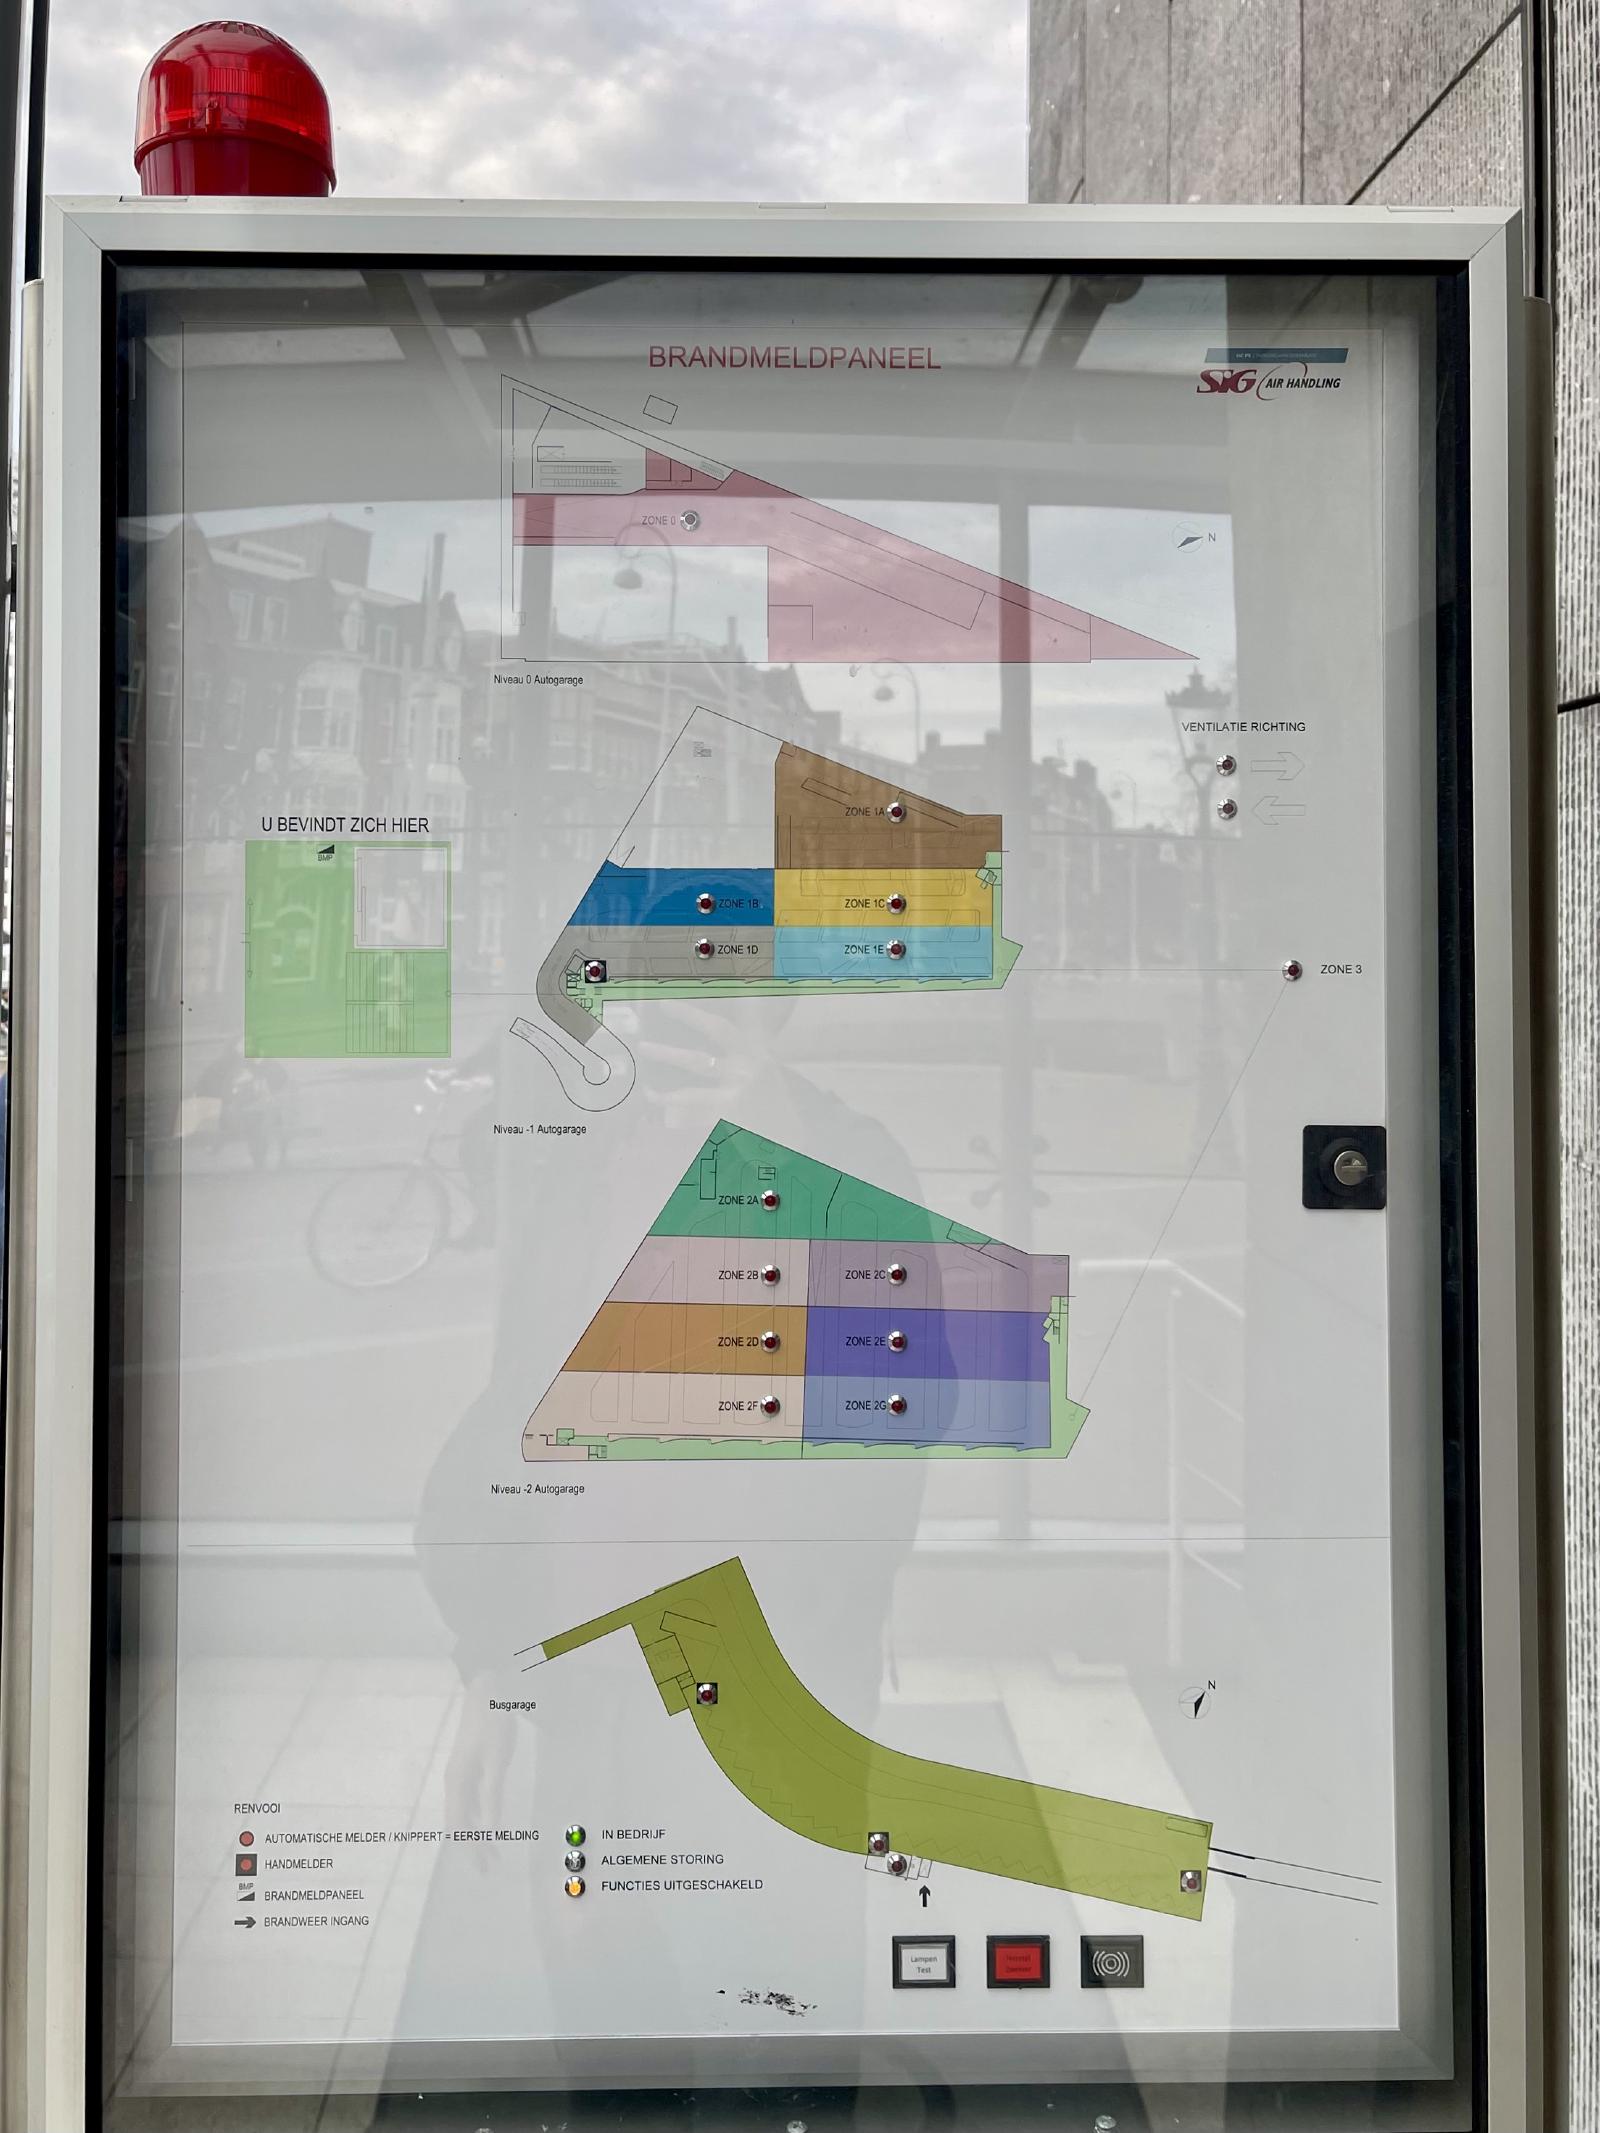
On a recent trip to Amsterdam, I began noticing large panels showing coloured floorplans with small LED lights labelled “BRANDMELDPANEEL” or “fire brigade panel”. They were mounted to the walls just inside the doors of museums, metro stations and other public buildings.
When firefighters arrive at the scene, they don’t know the building’s layout, which sprinklers are active, where power is disrupted, or which alarms are active. They need this information immediately to plan their response.
In these moments, clear actionable information saves lives.
The work we do in digital teams is similarly critical. Our systems should enhance, if not safeguard, users’ lives. We must ensure they run smoothly and that we allocate resources effectively.
Make the work visible
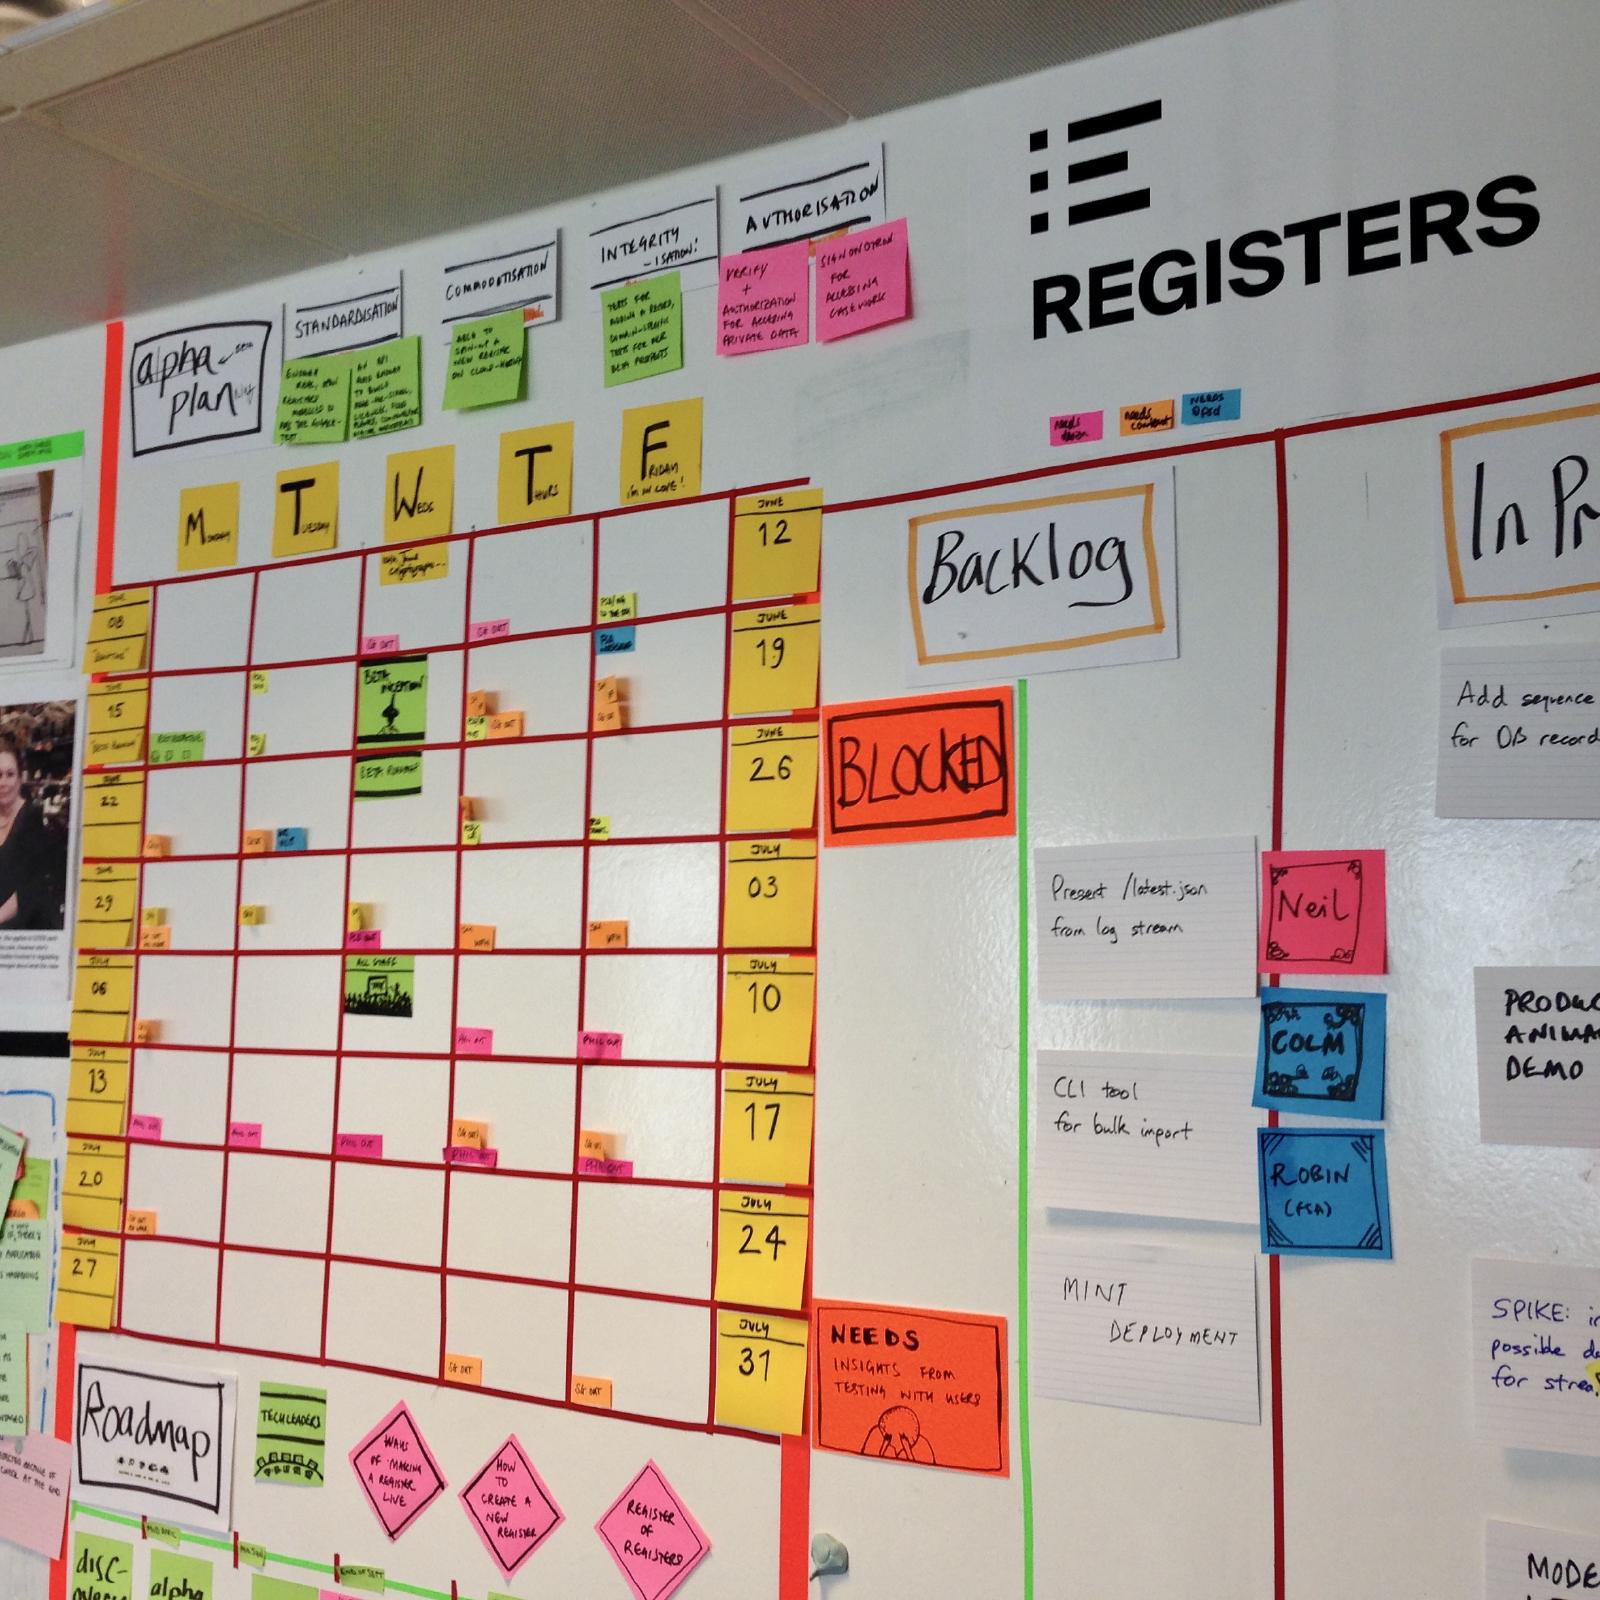
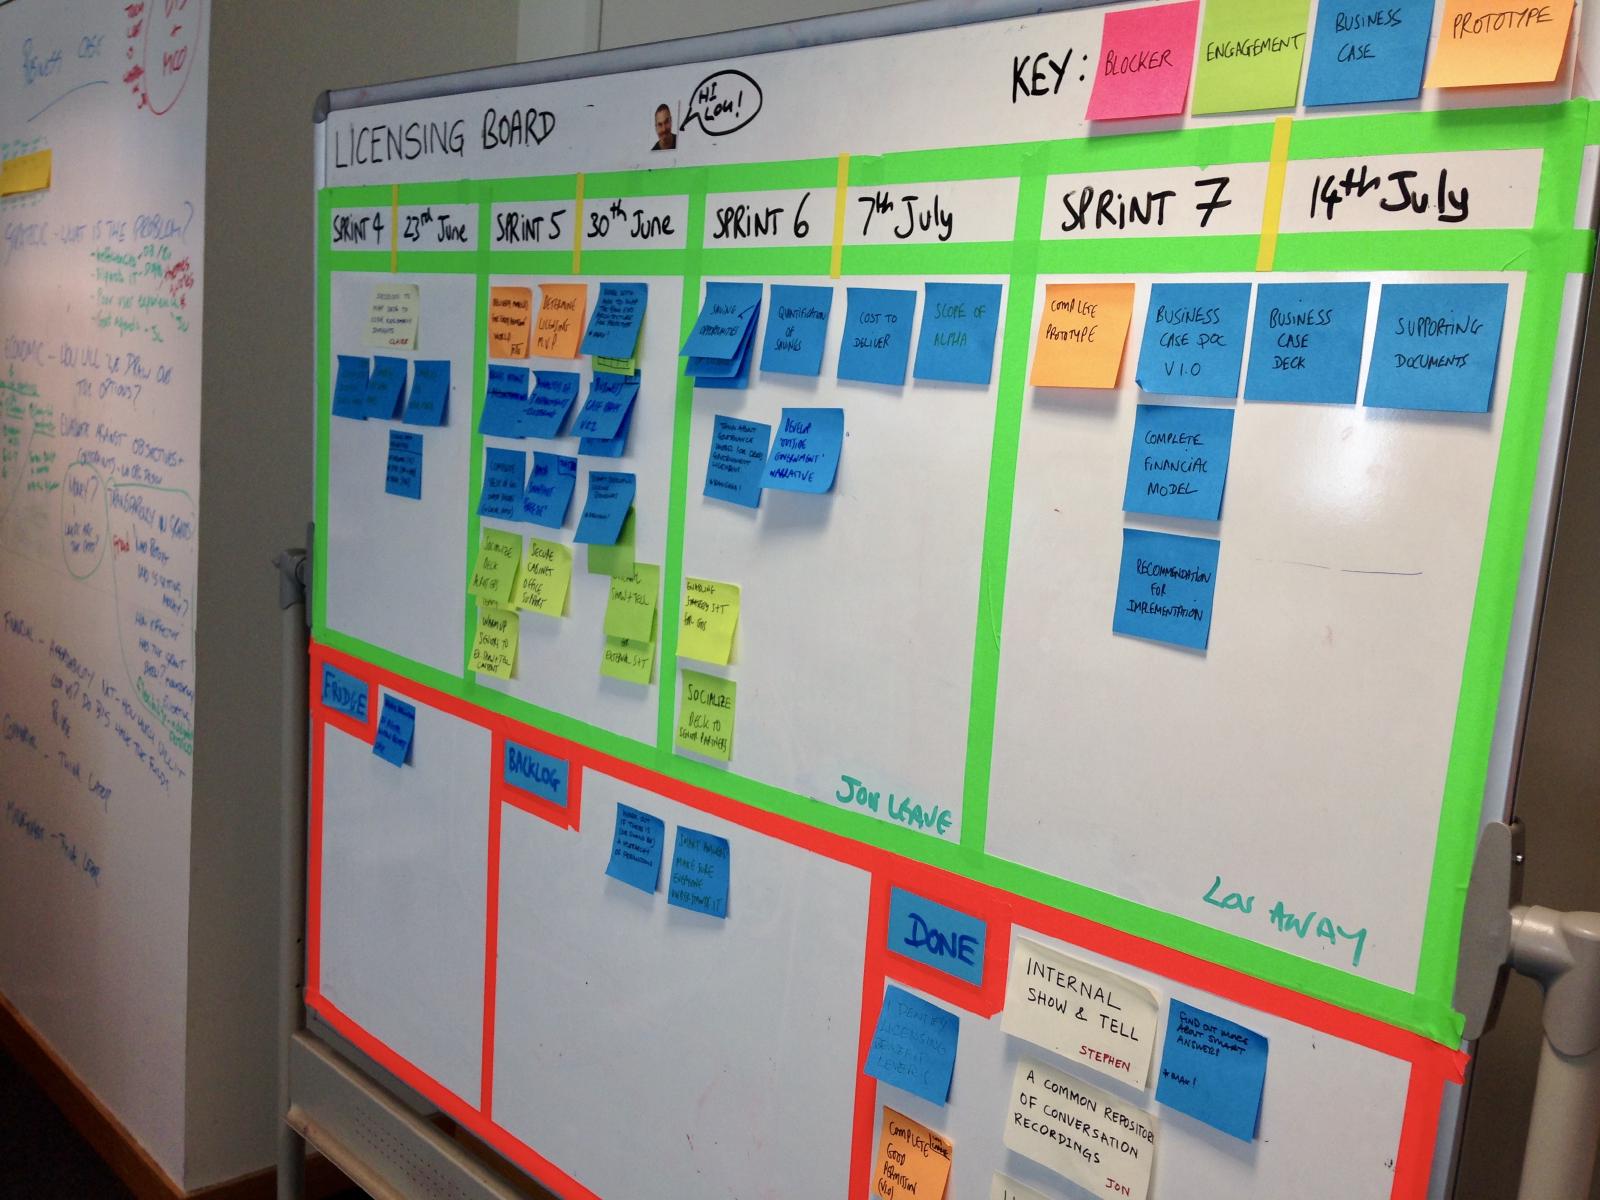
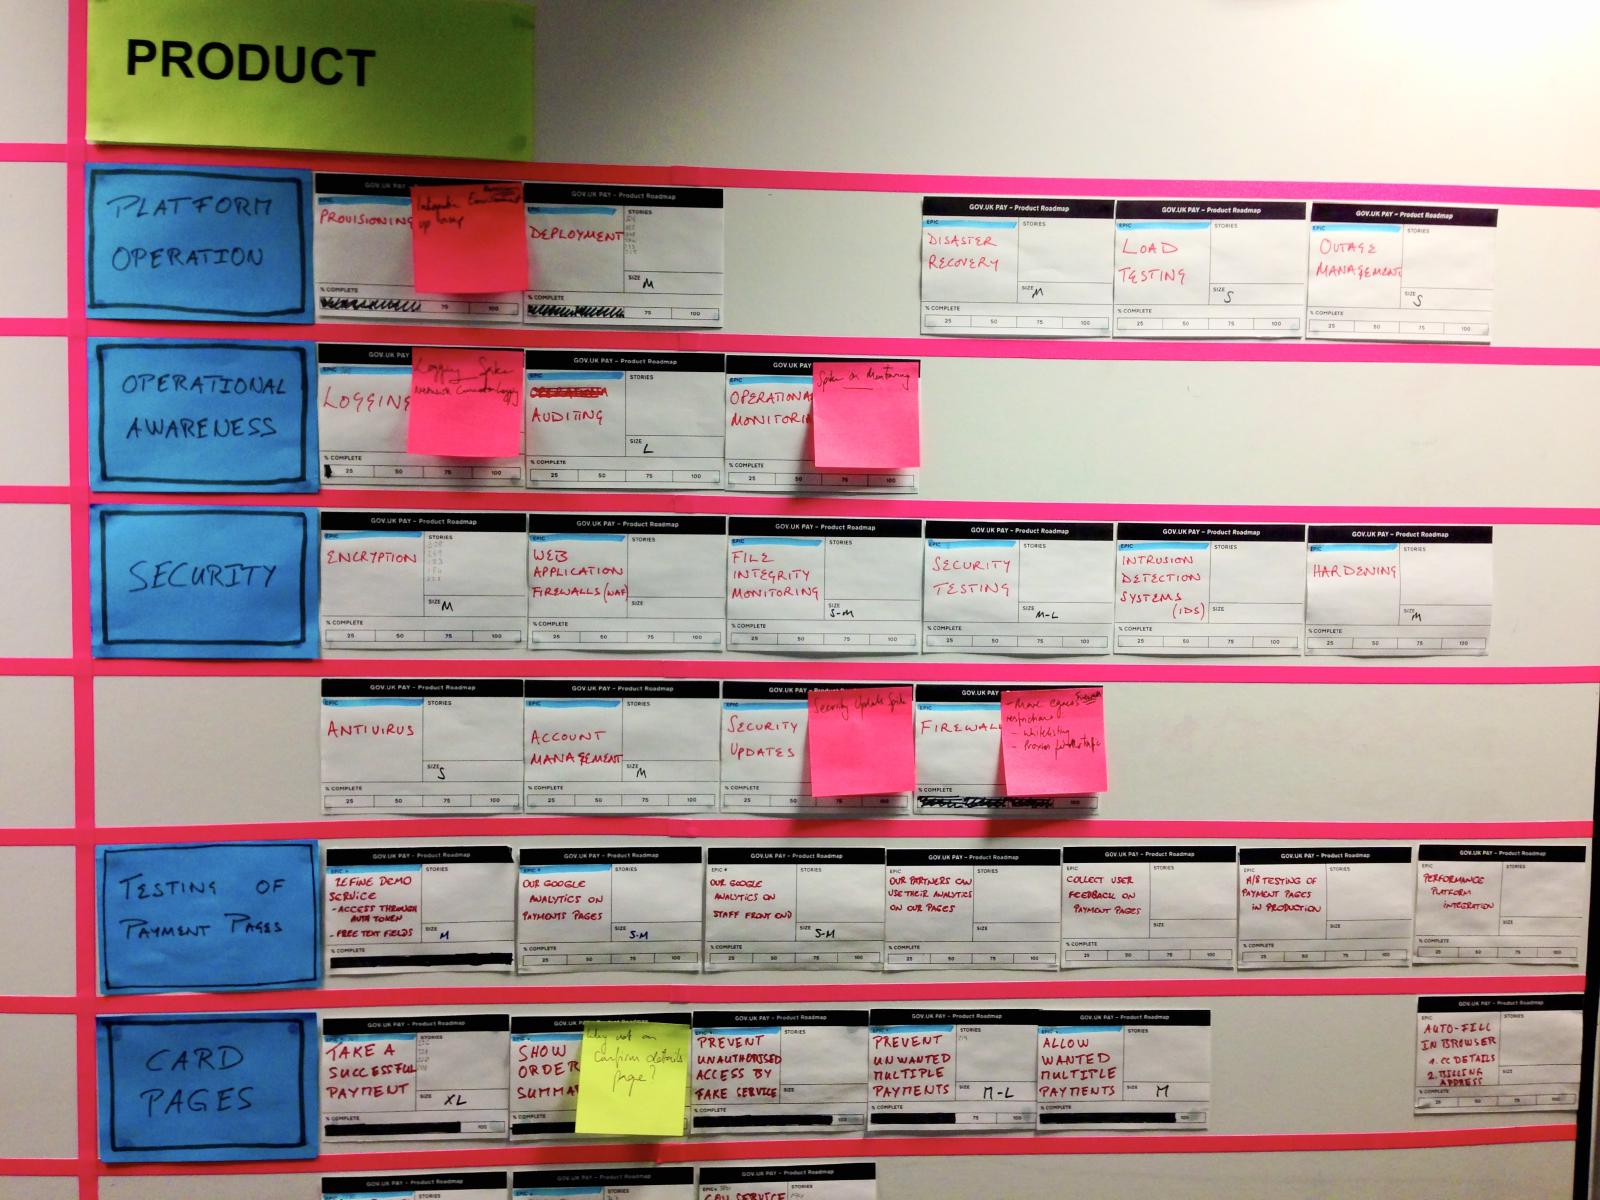
Visual control is one of my favourite techniques to use with teams building digital services. Everyone—stakeholders and team members alike—should instantly understand what work is happening, why it matters, its complexity, and its progress. This is why teams use kanban boards and other “information radiators” like my OKR tracking sheets.
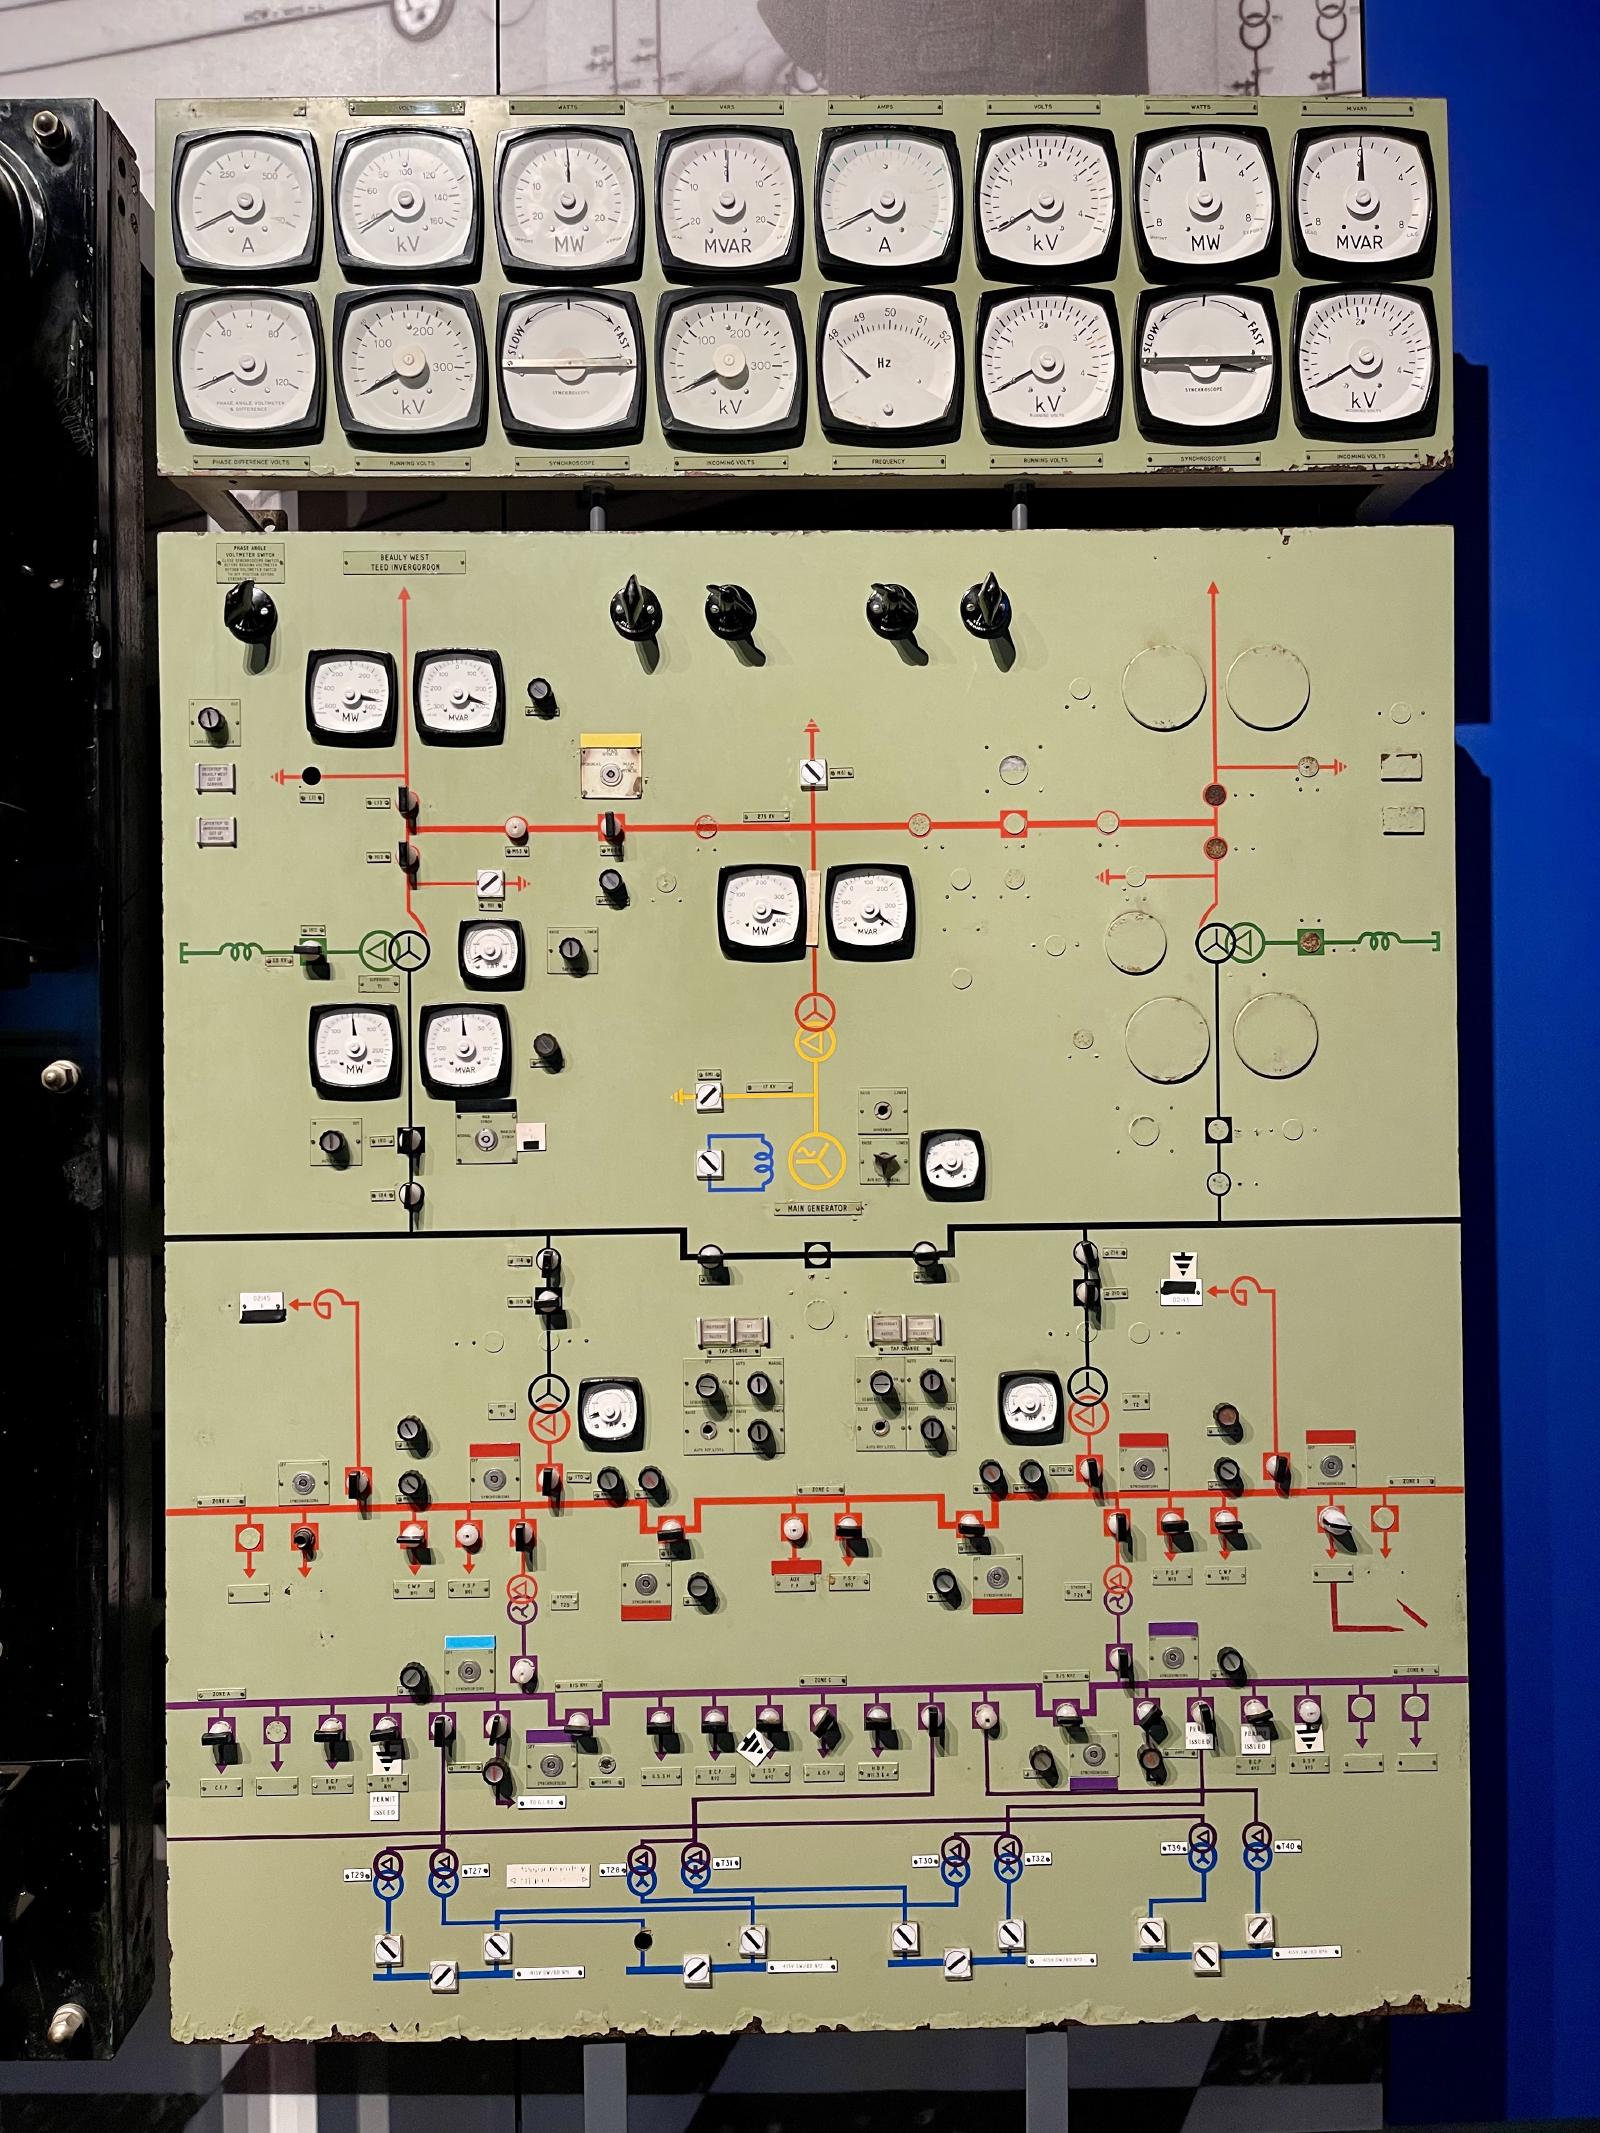
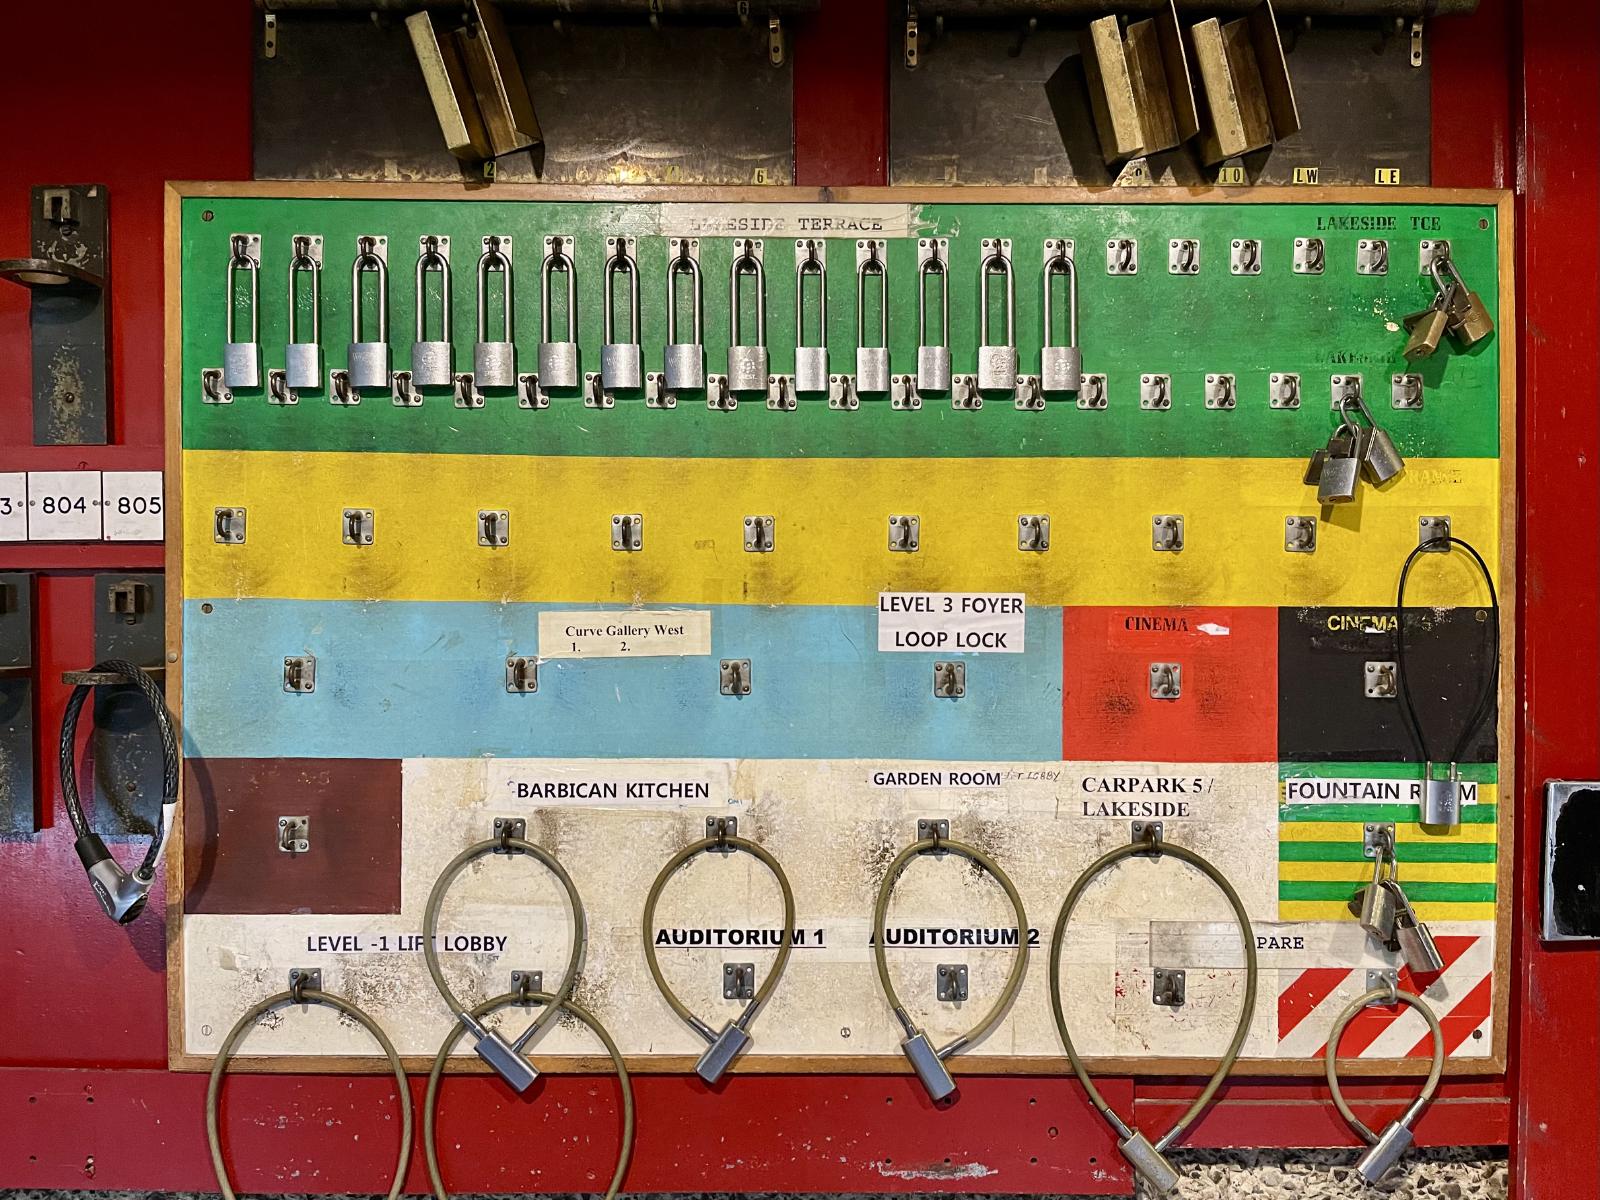
This technique isn’t new and certainly isn’t unique to digital teams. Teams on aircraft carriers, for example, wear different colours based on their roles. This makes it immediately obvious who’s doing what, if tasks are being done out of sequence, when higher risk activities are occurring or if someone is putting themselves at increased risk without realising it.
In past roles, I’ve embraced the concept of an “obeya” or “big room” to surround teams with the information they need for rapid, critical decision-making. I loved reading in Accelerate about the one they used at ING:
“This is the Obeya room where the Tribe lead’s work, priorities, and action items are visualized for the teams and anyone else who may schedule a meeting in this space or visit between meetings to update or review status. Here Jannes [IT Manager of Internet Banking and Omnichannel at ING Netherlands] meets on a regular cadence with his direct reports, where they can quickly see and understand the status of each of his strategic objectives. Four distinct zones are visualized: strategic improvement, performance monitoring, portfolio roadmap, and leadership actions, each with current information about targets, gaps, progress, and problems. Color coding is used—red and green—to make problems immediately visible. Each IT objective ties directly, in measurable ways, to enterprise strategy”
– Forsgren PhD, Nicole; Humble, Jez; Kim, Gene. Accelerate: The Science of Lean Software and DevOps: Building and Scaling High Performing Technology Organizations (p. 206). IT Revolution Press. Kindle Edition.
Recent work
In January of this year, I rejoined the Government Digital Service to help teams deliver the recently announced blueprint for modern digital government.
Lots of teams use visual control mechanisms to help manage their work but I’m wondering: could we use visual control techniques across the entire portfolio? Can we make it clear which teams are working on what outcomes, how much we’re spending, where we feel confident, where we need help, and how leaders can intervene effectively? Can we make it simple to see what work should be stopped, started, paused, or pivoted?
What’s next?
We’re already building canonical registers of delivery data to power portfolio-wide dashboards. Initially, we’re assembling lists of teams and leads, defining outcomes as quarterly OKRs, and categorising them. We’ll expand this to track team sizes, investment levels, burn rates, risks, mitigation plans, and finally integrate everything into an internal and external communications strategy.
Soon we’ll host our first design charrette with members from the strategy & delivery management communities where we’ll prototype ideas.
Using simple tools like spreadsheets, slides, week notes, and some automation, we’ll create dashboards and storytelling tools that help teams report on confidence and progress and get the support they need.
Share your photos
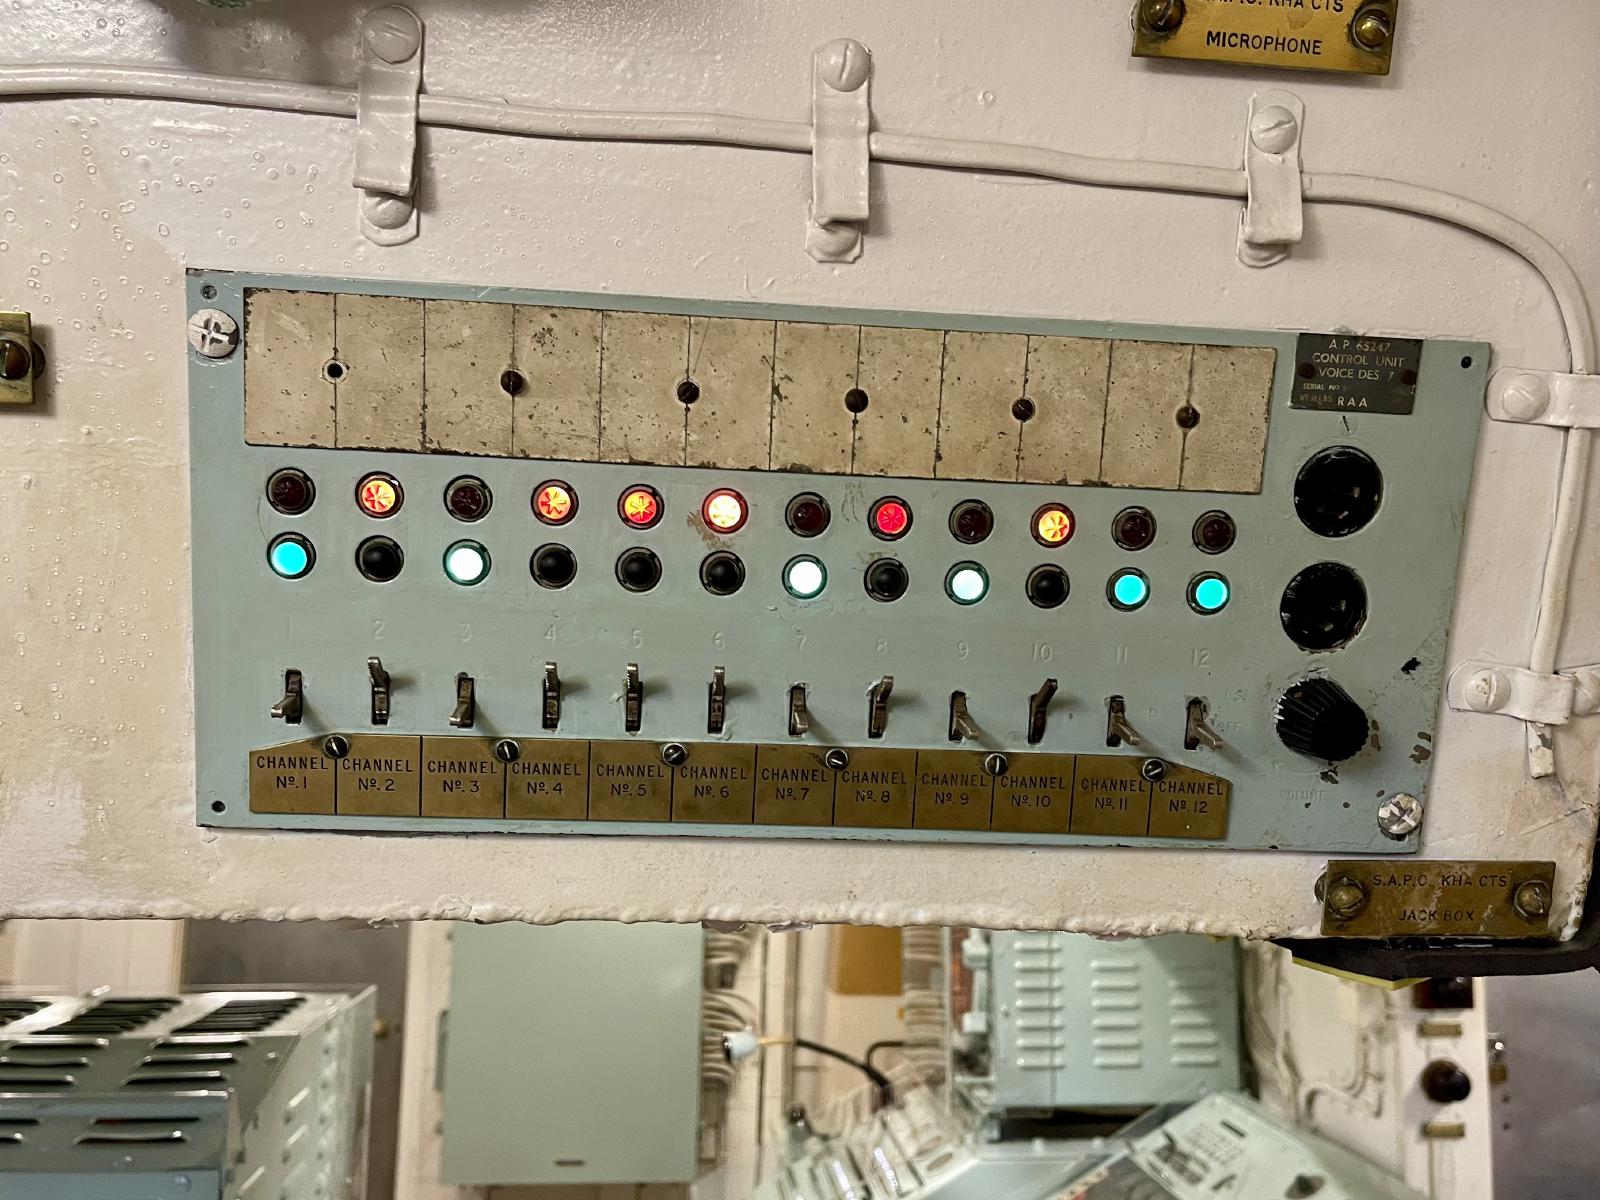
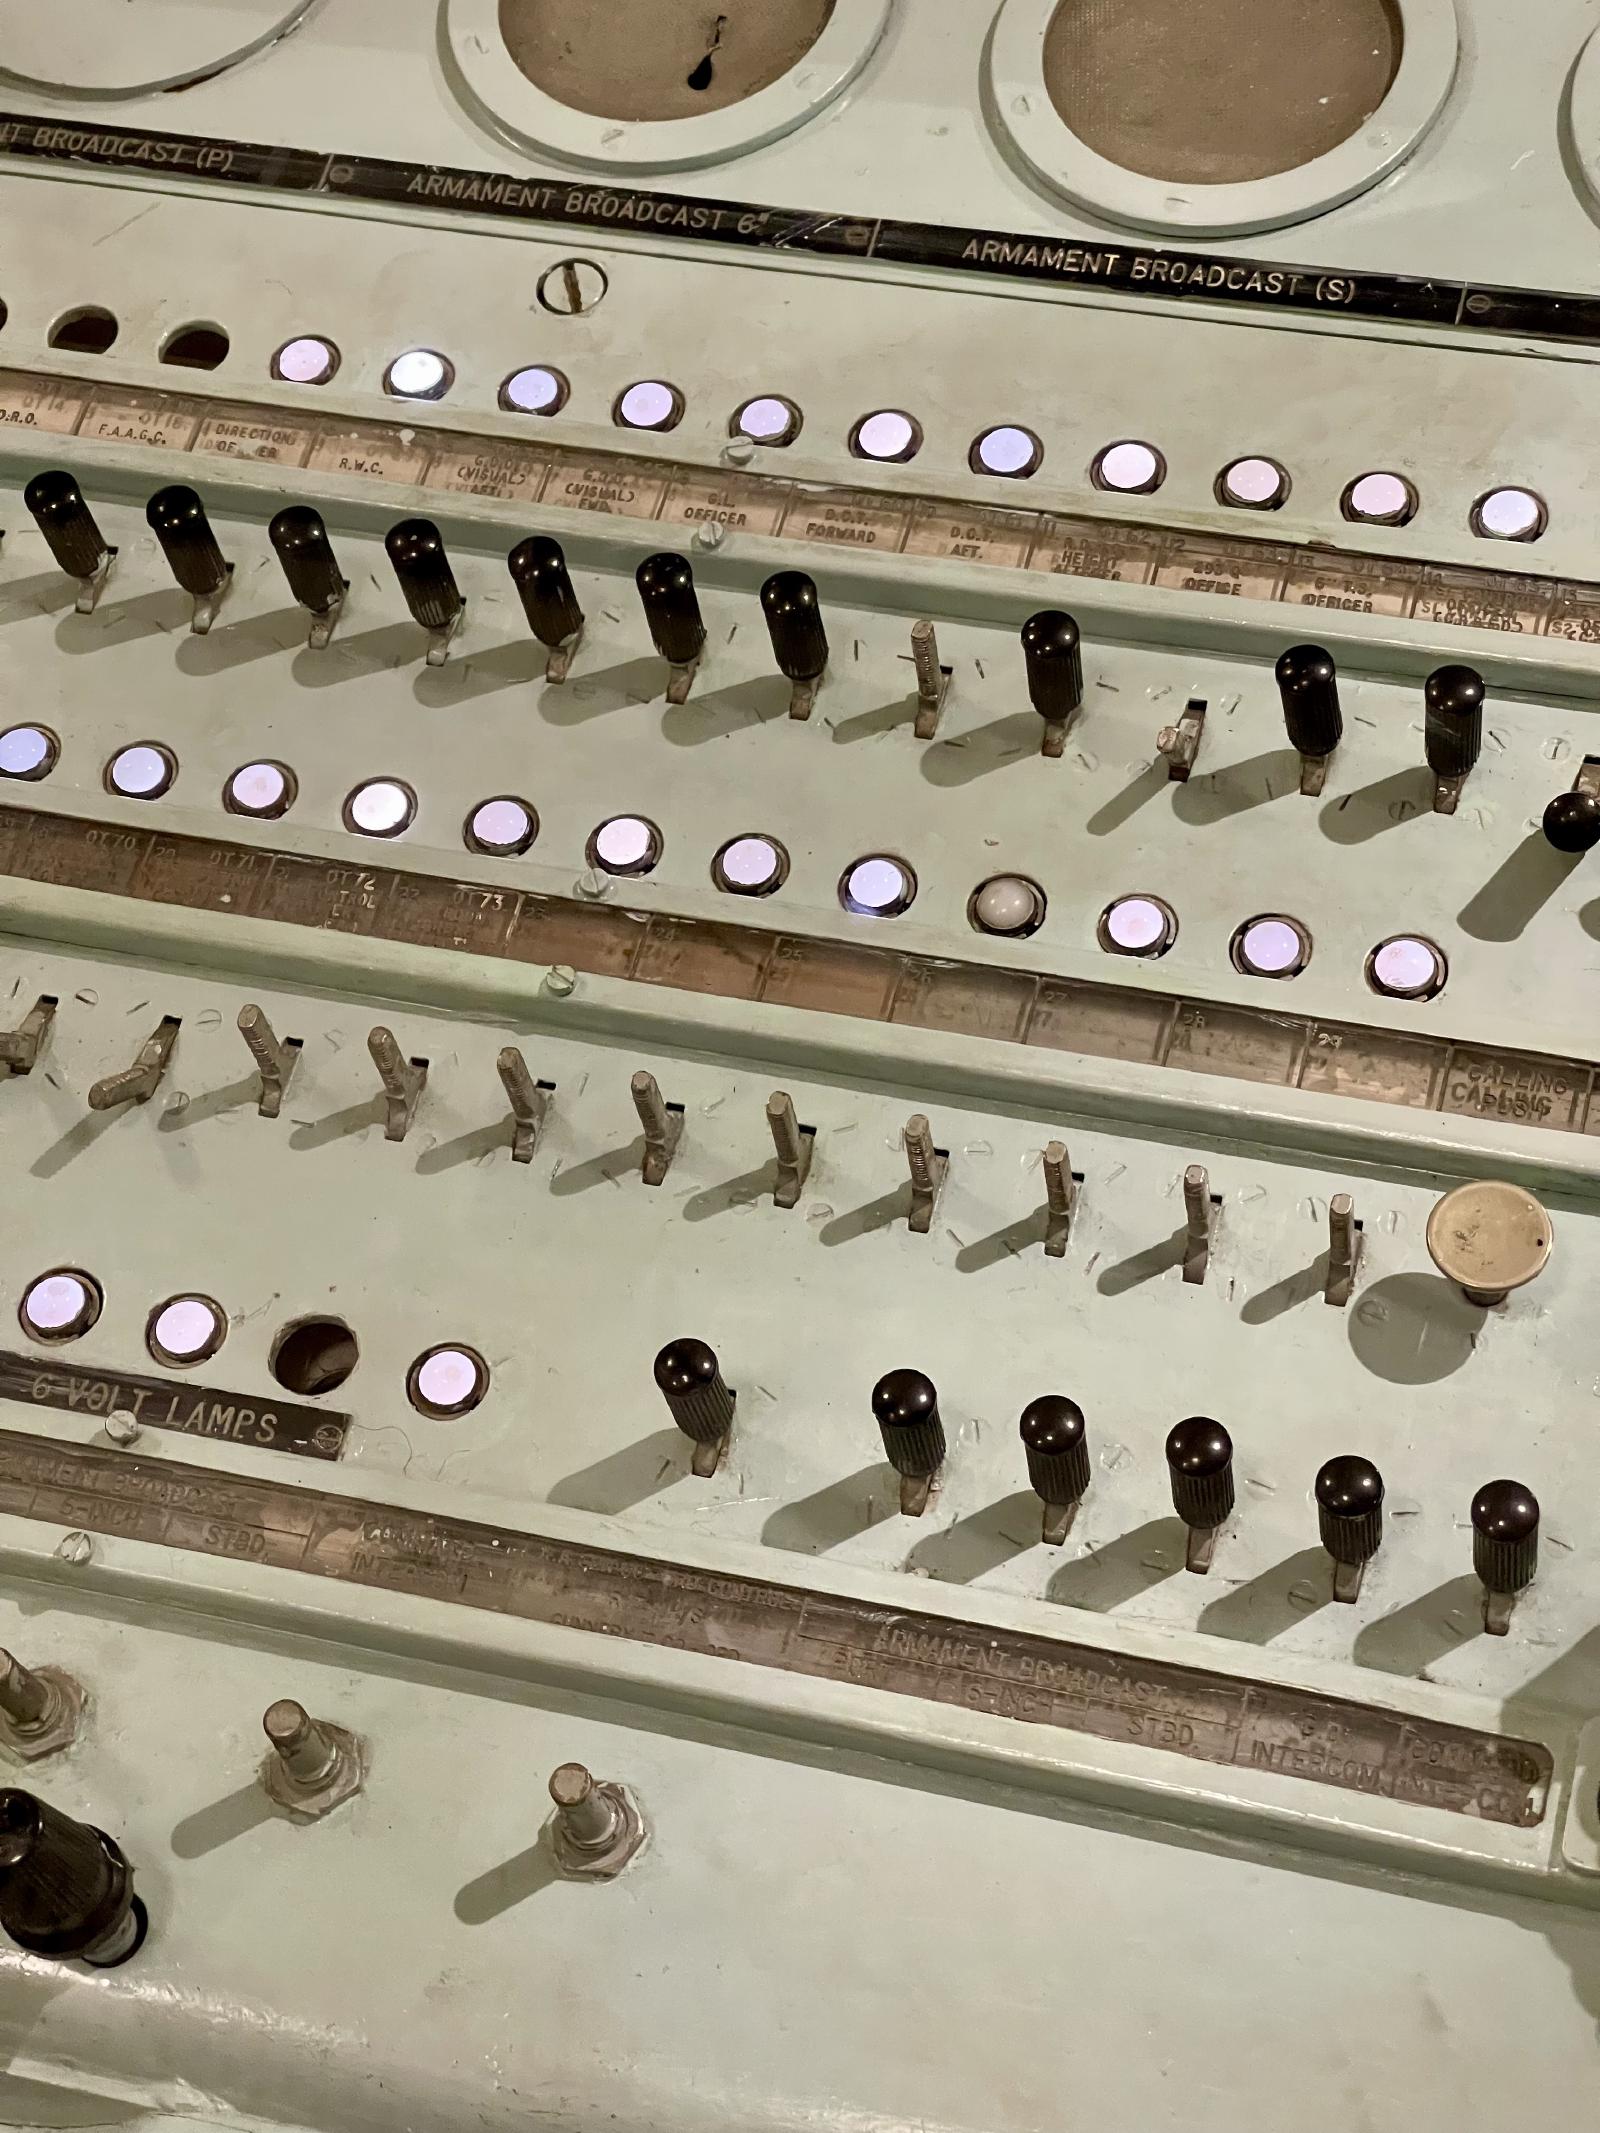
What examples of fire brigade panels or obeyas and information radiators have you seen? Please send me your photos and I’ll add them to this collection!
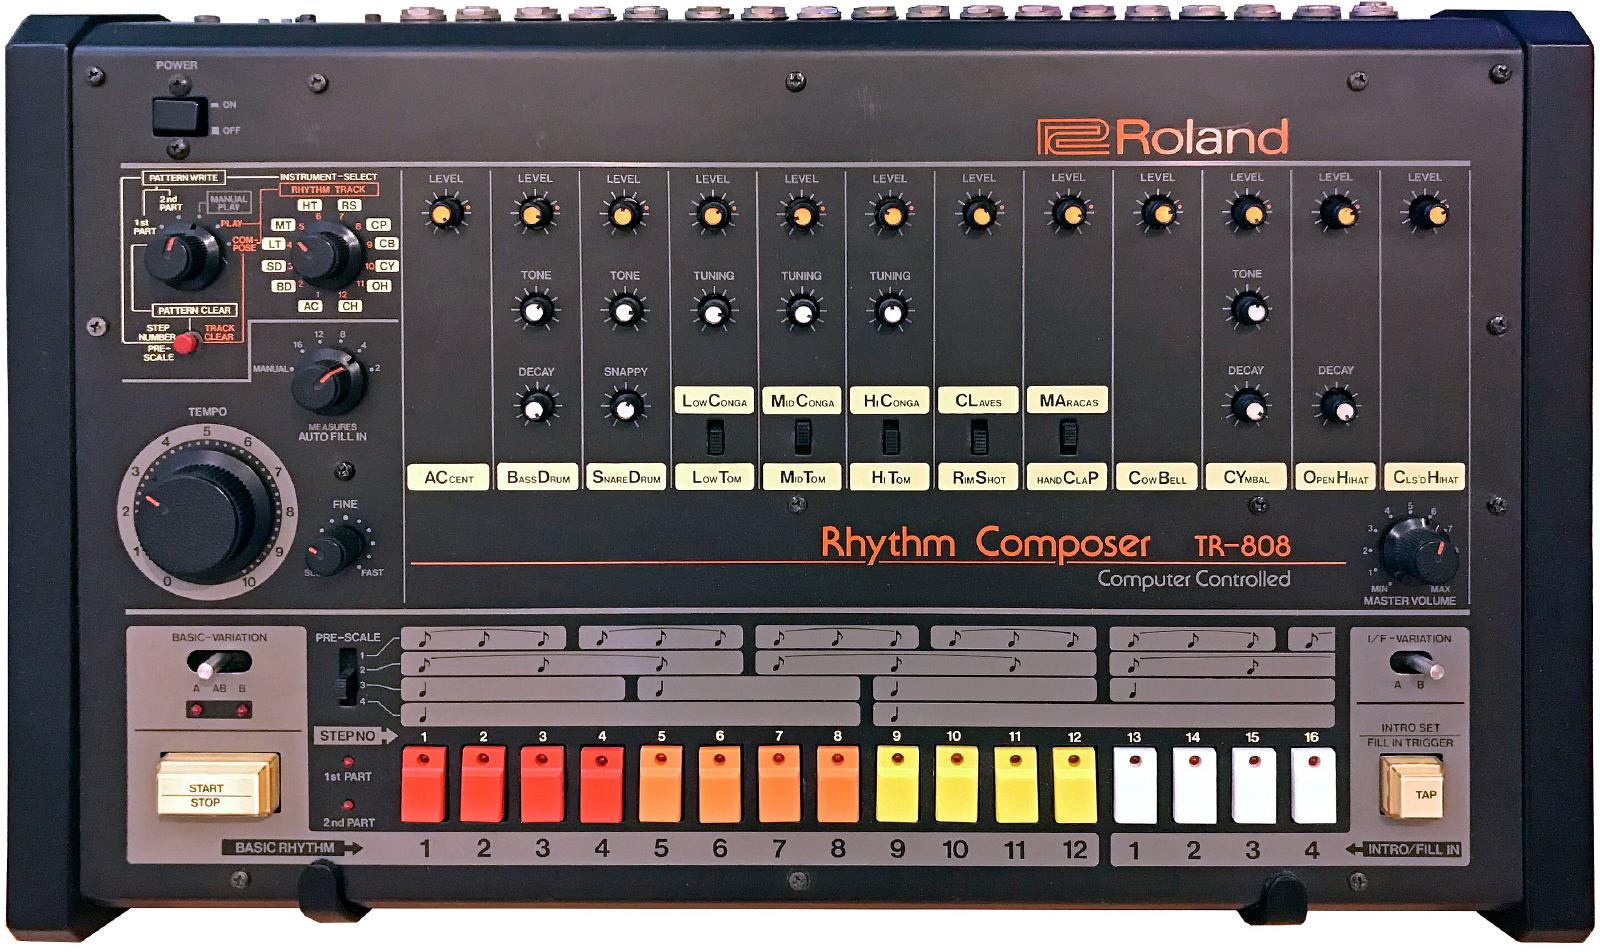
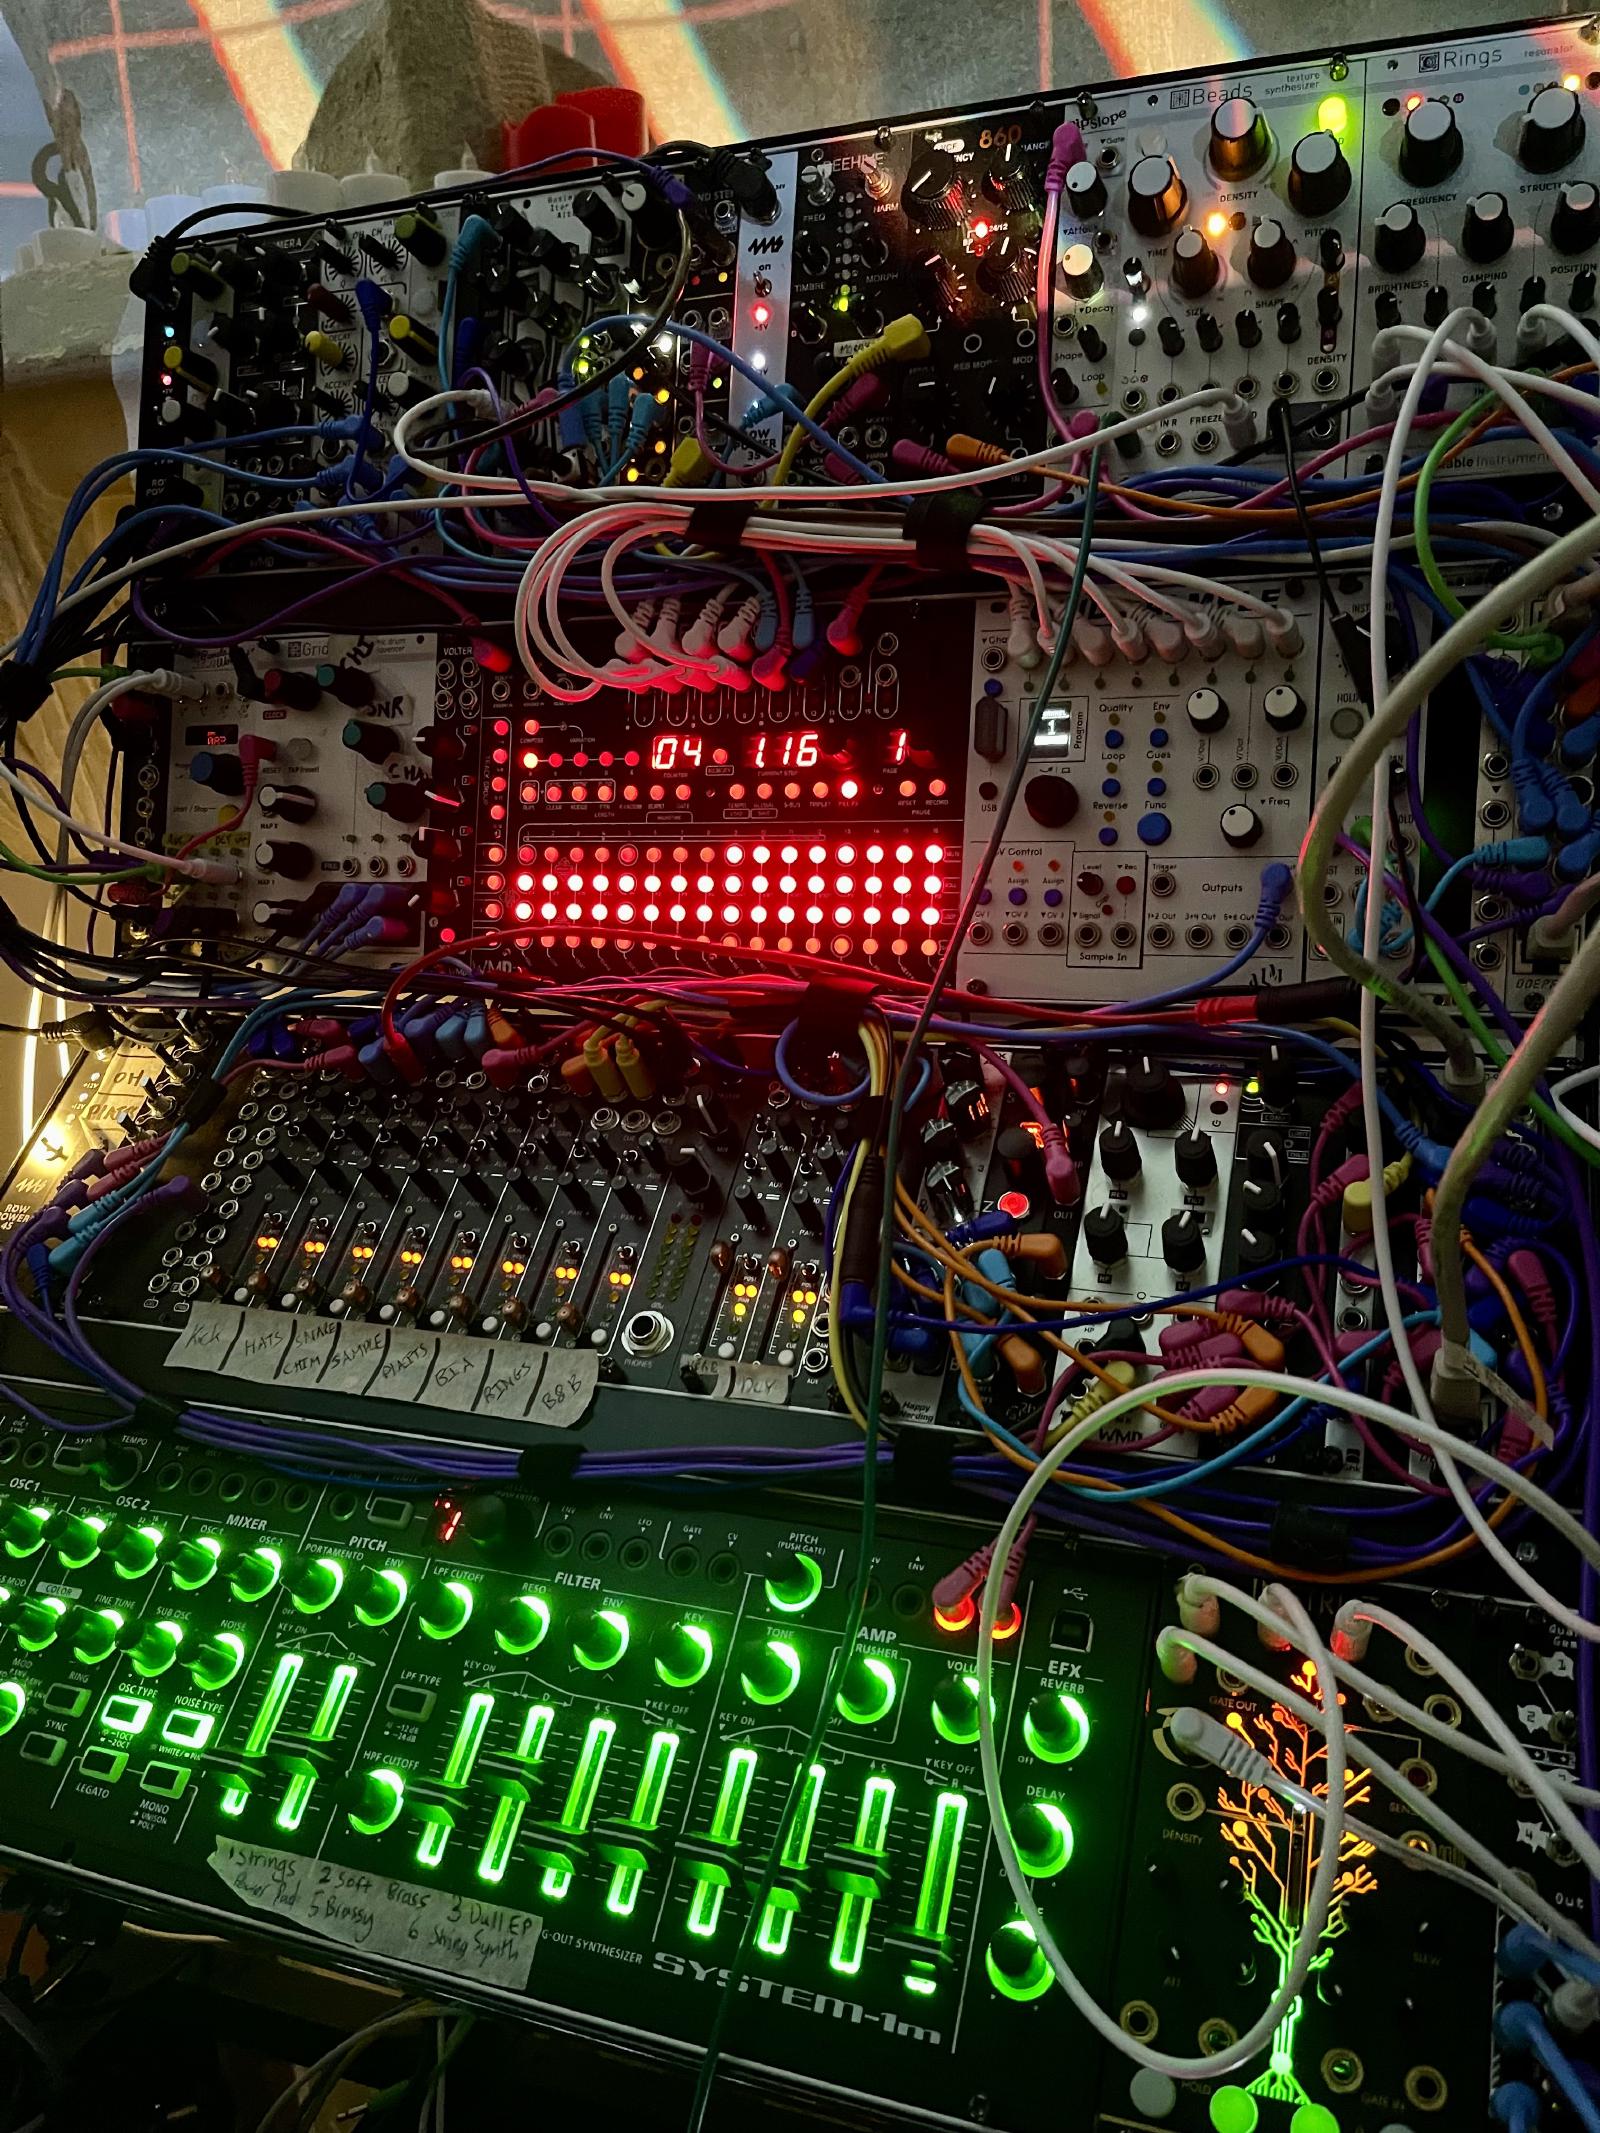
Photos below are by me unless noted otherwise.


About Peter Kappus

With more than 25 years of experience, I use OKRs, agile practices, and more to help teams maximise clarity, delivery, and joy.
Helpful OKR help
For over 10 years I've offered practical, fun, inclusive OKR training and coaching based around your needs.


Keep in touch
Get my latest ideas and tools straight to your inbox.
Share
Do you know someone who would benefit from my work? Please share!